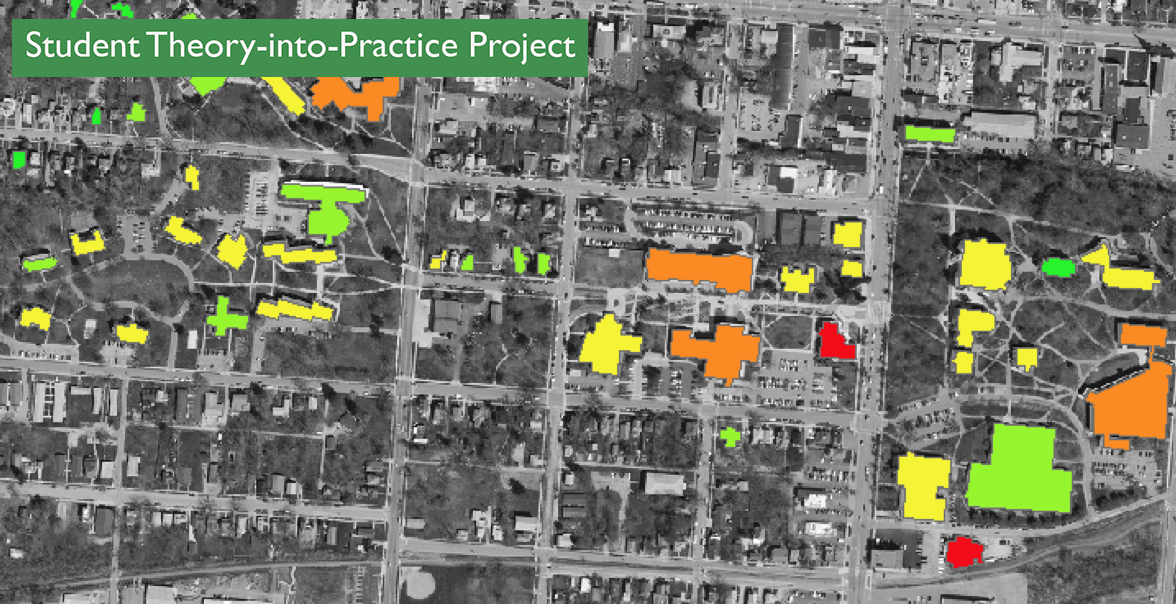
A student theory-into-practice project focused on processing, analyzing and mapping energy data for the Ohio Wesleyan campus. A significant part of the project focused on the development of an equation so that the relative energy efficiency of buildings on campus (which vary widely in size, usage, age, etc.) could be compared.
Building Energy Monitoring and Analysis
Ohio Wesleyan University and Delaware, Ohio Sustainability Region
August 2012
Silas Jolliff, Adam Pinkerton, Jon Rux, Mason Tice, Keegan Varner, John Krygier, Sean Kinghorn
Summary
The purpose of the Energy Monitoring and Analysis project was to process energy data and create a map showing energy usage and efficiency on the Ohio Wesleyan campus. The map displays energy use and efficiency in relation to building hours, building size, and number of people per building. The data is, then, normalized to take into account important differences from building to building. This map is based on the most recent full-year utility data (2010) and has the ability to be updated annually as new data becomes finalized. Proposed developments include real-time utility monitoring (in addition to data from utility bills), the inclusion of City of Delaware-owned buildings (and other public buildings) in the project, direct feeds of utility data into a database for the sustainability region, and access to and display of the data in a real-time interactive map linked to the sustainability region database.
This map will help raise awareness of the patterns of energy usage on campus for students, faculty, prospective students, and alumni. It would also be of use to school administrators when determining where to focus efforts to improve the school’s environmental footprint. As the project spreads to off-campus buildings, similar impacts can be expected. Students, city employees, and others can experiment with energy reduction strategies and document pre- and post-experiment utility usage, thus providing significant empirical evidence for evaluation and assessment.
Methods and Results
OWU utility data was acquired from the OWU Sustainability coordinator, Sean Kinghorn, for a majority of the buildings on campus. The data was normalized using three separate methods:
- Average kWh per person
- Average kWh per hour of operation
- Average kWh per square foot
For the residential side, we isolated the utility data and extracted the buildings that were not in use or had since been removed. This data was coded using street addresses, so we used Google Maps to locate buildings and come up with the building names recognized by OWU. We also had to take monthly averages for the utility data to account for summer and incomplete months. Next, we developed a methodology to normalize the data. The average kWh per person was calculated based on a housing count from the OWU Residential Life office for the two academic semesters included in the data. Because the number of inhabitants changed between semesters, we took an average of these two numbers. We then divided the monthly average electricity usage by the number of inhabitants. The Average kWh per hour of operation was based on results from a campus-wide survey we undertook. The survey found that students spent an average of 14.74 hours in their dormitory, fraternity, or SLU. Next we divided the monthly average electricity usage by the 14.74 statistic. Lastly, average kWh per square foot was calculated with building data acquired from Sean Kinghorn. Finally, we divided the monthly average electricity usage by the gross square footage.
To obtain data for the academic side of campus we started by analyzing utility data given to us by Sean Kinghorn. We had monthly totals for total electricity consumption in kilowatt hours (kWh). To make this data more accessible to the general public, we normalized the data in a manner similar to the residential side. We started by data scraping class lists from the OWU Self Service website. Importing the data to Excel, we then took the total number of people for each building and multiplied it by 2.5 to obtain a weekly number per building (this was assuming an even distribution of 3 day per week and 2 day per week classes). We then took this total and multiplied it by 4.21, or the average number of weeks per month. This gave us the monthly average of students per building. We also determined the average number of faculty per month, per building, considering faculty spend far more time in the buildings than students. After obtaining the numbers from the OWU website, we multiplied them by 5, assuming 5 office days per week, and then again by 4.21. Combining these two totals, we had an estimate of the number of people in each non-residential building. We then divided the number of people per building per month by the energy consumption per month, giving us our monthly average.
We then looked at the gross square footage of each building. We found the size of each building in the utility data provided to us. To determine the efficiency of each building in relation to its size, we simply divided the size of the building, in square feet, by the energy consumption per month.
Finally, we found building hours for as many buildings as possible. Some buildings were found by contacting the Public Safety office, while others were found manually. We found the hours for approximately 90% of all buildings on campus. As with the other buildings, we took the posted hours and multiplied them by 5, and then by 4.21, giving us a monthly average of hours spent open. We then divided the monthly average by the energy consumption per building.
In general, the data variables we chose and methods used to collect the data should be critically reviewed by experts in building utility efficiency and adjusted to more adequately reflect efficiency criteria. However, we believe we have established a valid approach to generating energy use and efficiency data that allows for valid building-to-building comparisons.
Finally, we imported the data into ArcGIS. To do this, we had to convert our spreadsheet data to a DBF file, then join it with an attribute table in ArcGIS. We picked the simplest parameter we could, Building Code, and then matched the two files up manually, editing the attribute table as we progressed. Once finished, we joined the tables in ArcGIS and created a series of maps. The classification (categorization) of the data on the map is based on generic map classification schemes, and should be adjusted to match external criteria for assessing building energy efficiency. See Appendix A: Maps for examples of the maps that can be generated.
Recommendations
- An expert in building energy efficiency should evaluate our methodology for normalizing building energy use and efficiency, as well as the classification of the data on maps (to match external criteria for assessing energy efficiency).
- Acquire building utility monitors for more buildings and establish direct links from utility monitors in buildings to a database for the sustainability region. Establish direct links from digital data sources of the other variables (student, faculty numbers in buildings, hours, etc.) to the database when possible to maintain accuracy of the normalized data.
Building Utility Monitors: The OptoEMU Sensor Energy Monitoring Unit
Information: http://www.opto22.com/site/pr_details.aspx?cid=1&item=OPTOEMU-SNR-3V
Cost: X units at $1,295 per unit: = $XXXX total
- Extend the utility monitors and data normalization methods to City of Delaware buildings and analyze and map the data in a manner similar to what was done with campus building utility data.
- Develop energy reduction and efficiency projects that can be documented with the normalized real time utility data available in the Sustainability Region database and mapping software.
Appendix A: Maps
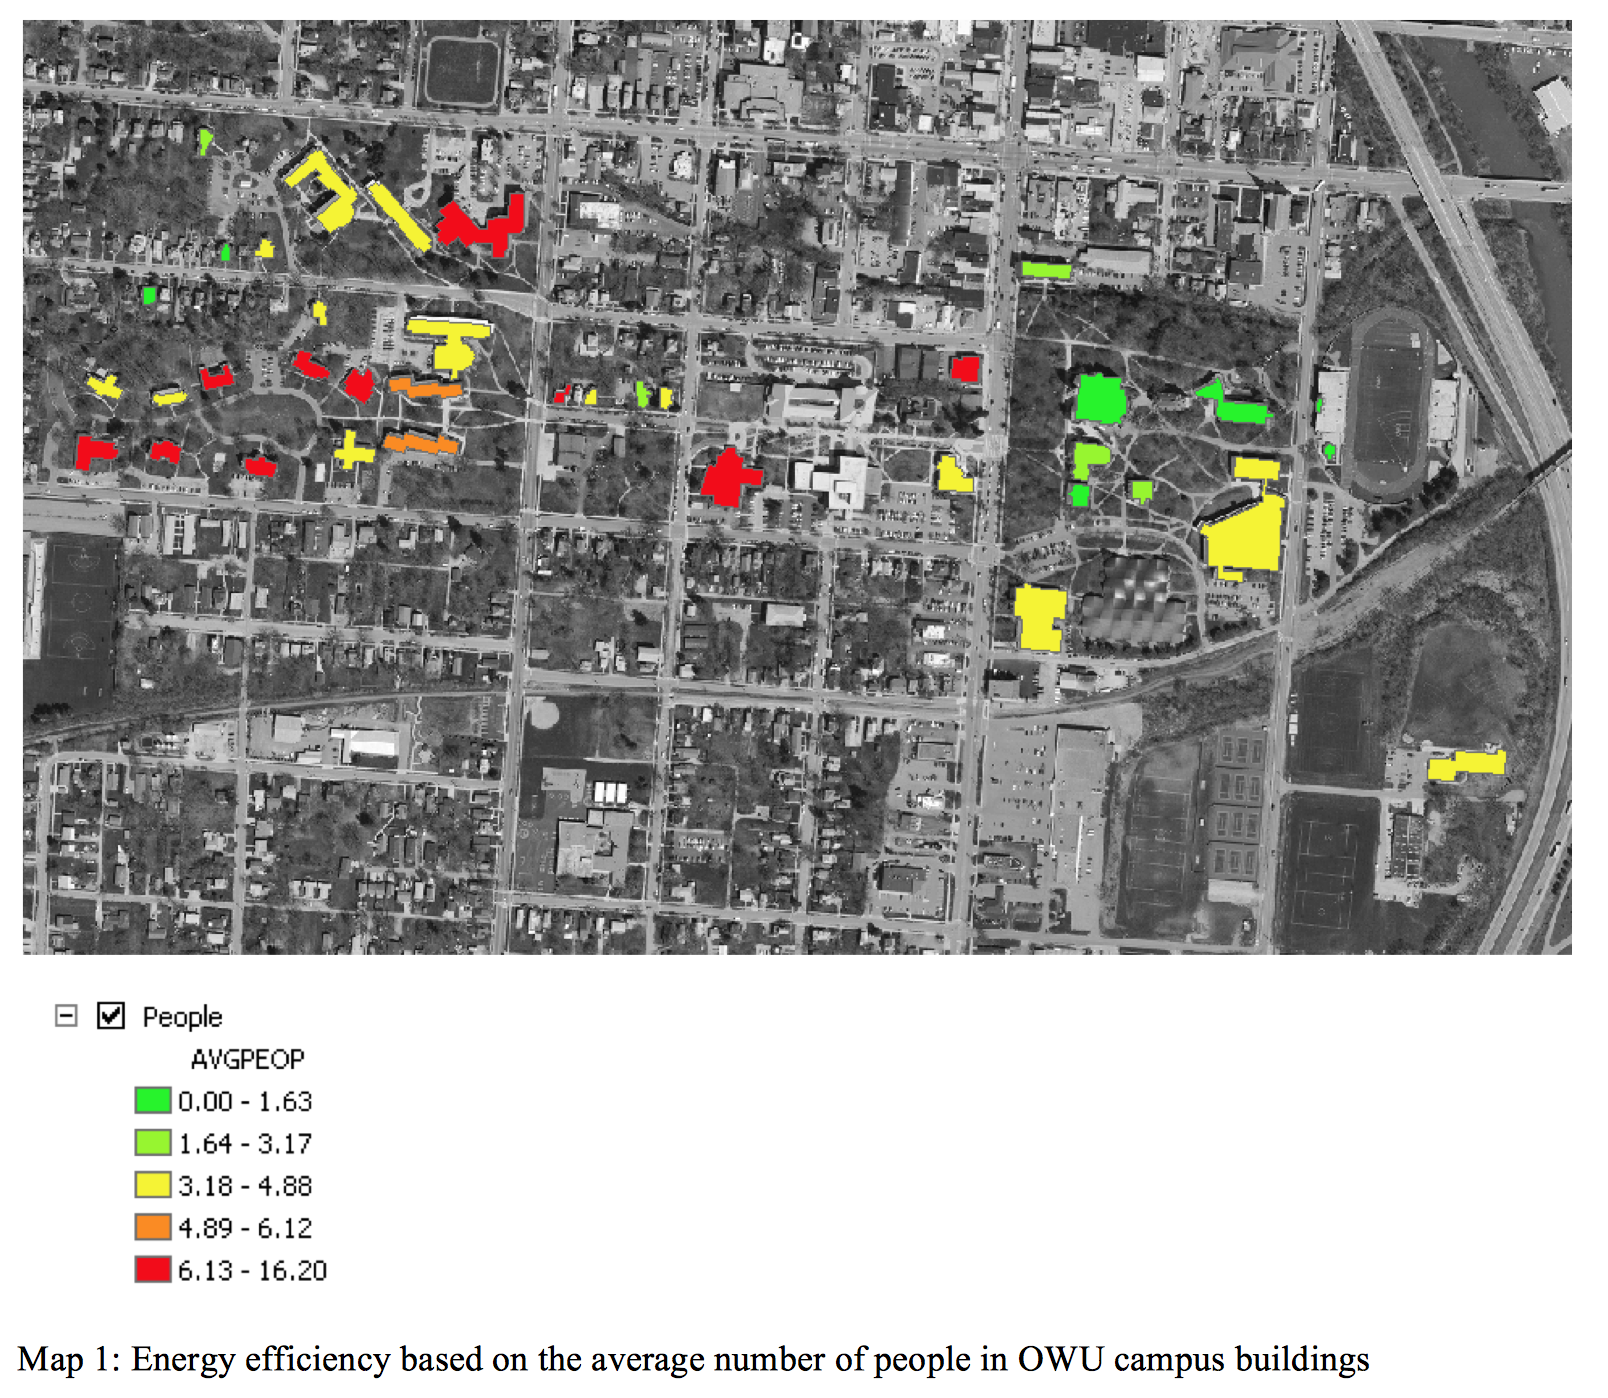
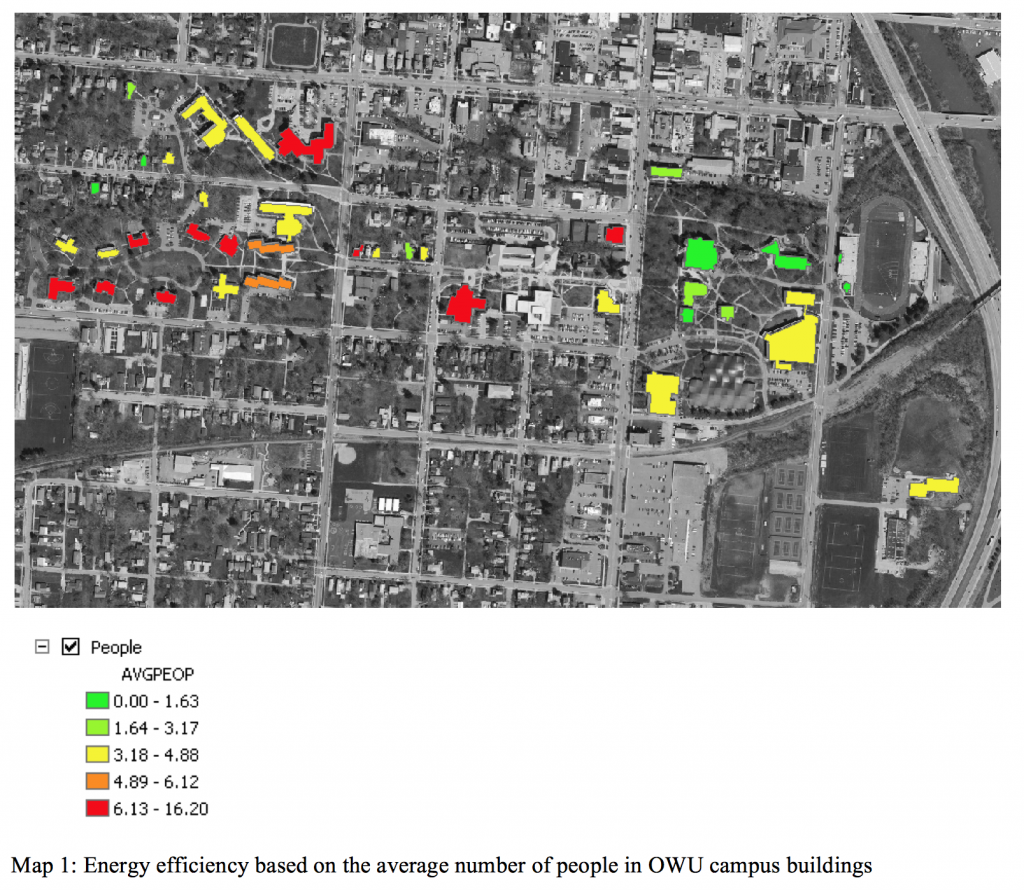
Map 1: Energy efficiency based on the average number of people in OWU campus buildings:
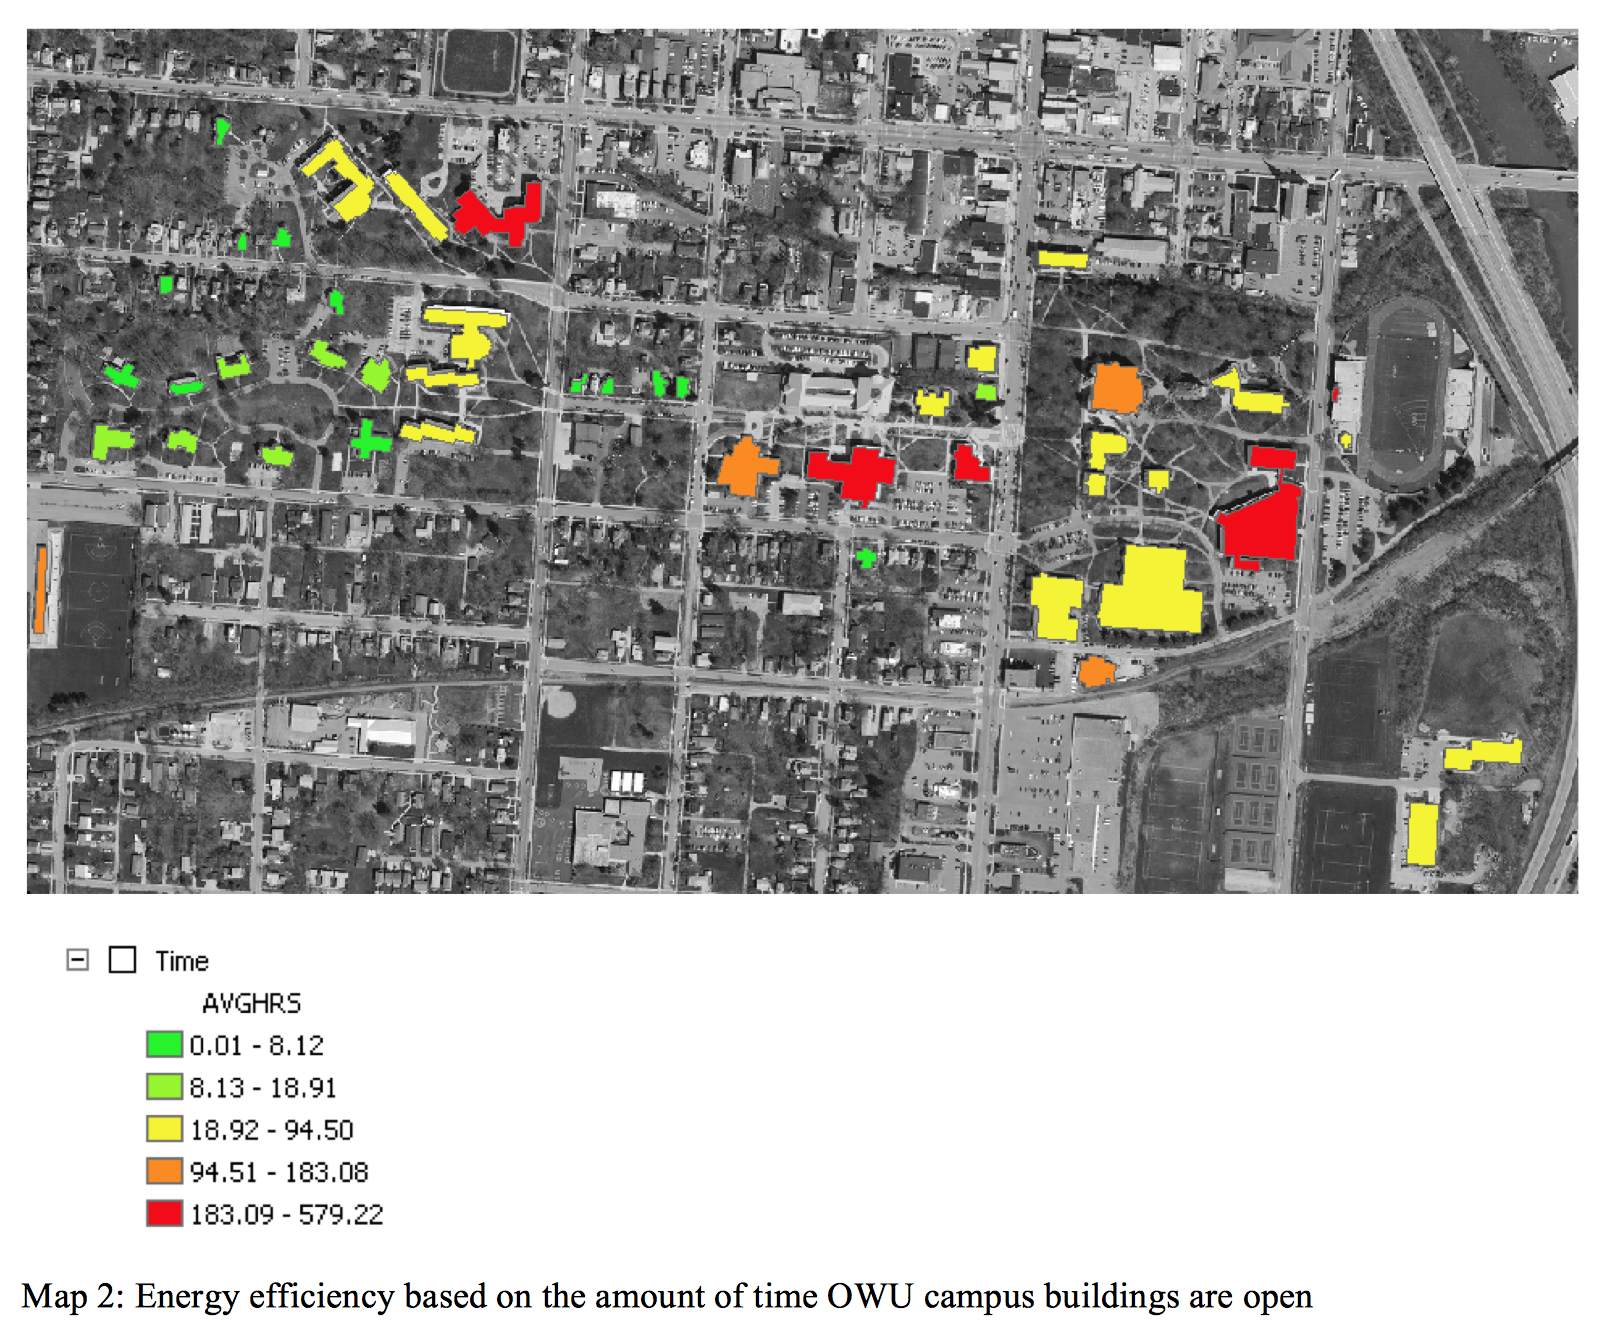
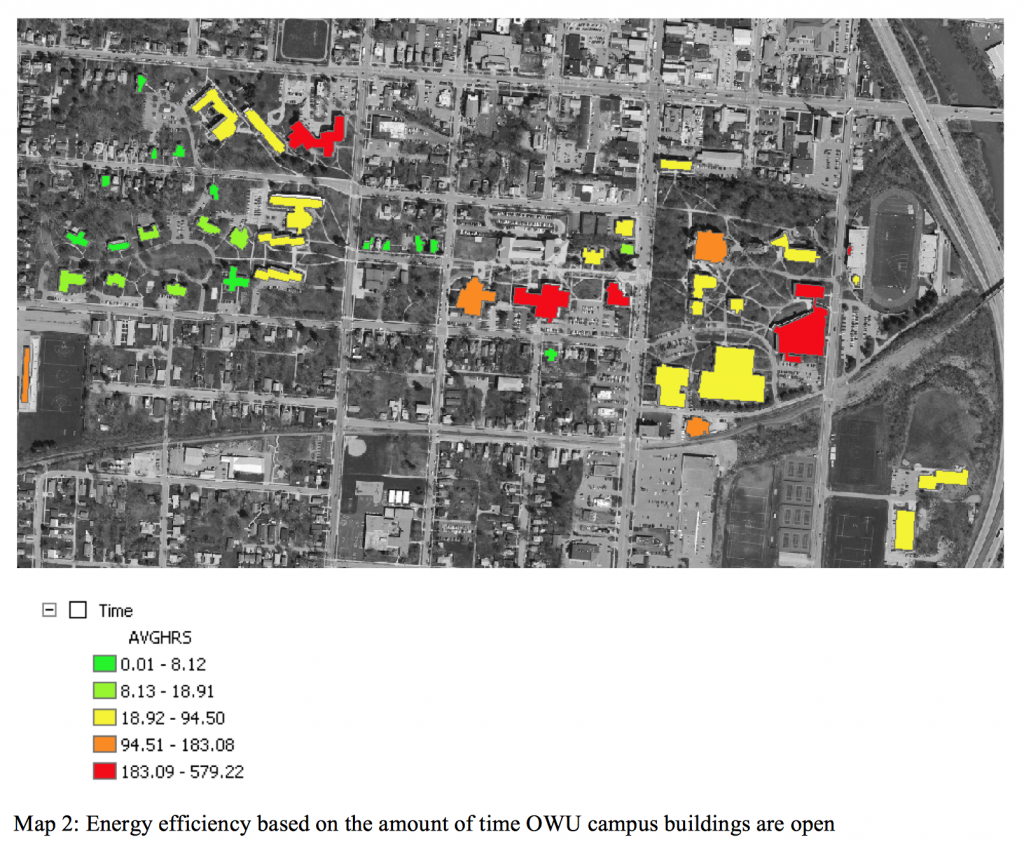
Map 2: Energy efficiency based on the amount of time OWU campus buildings are open:
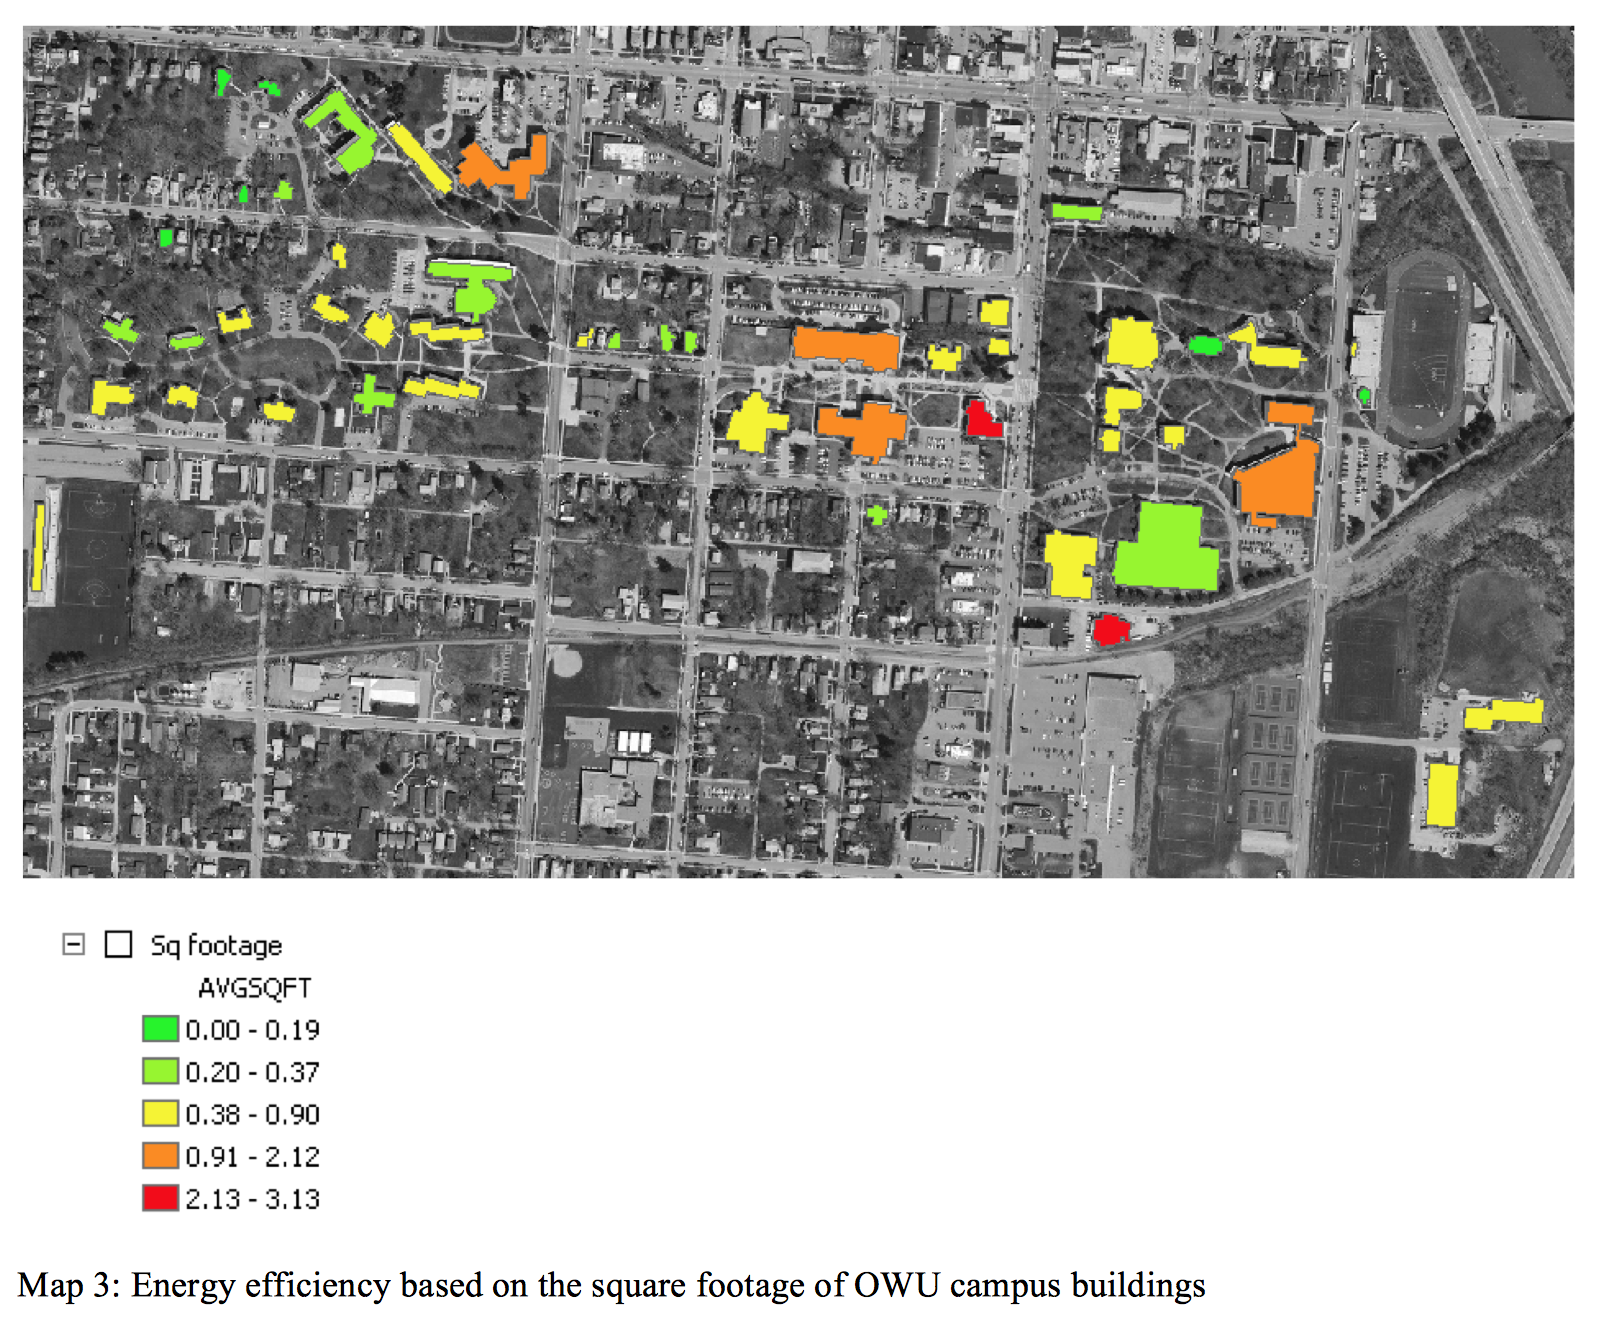
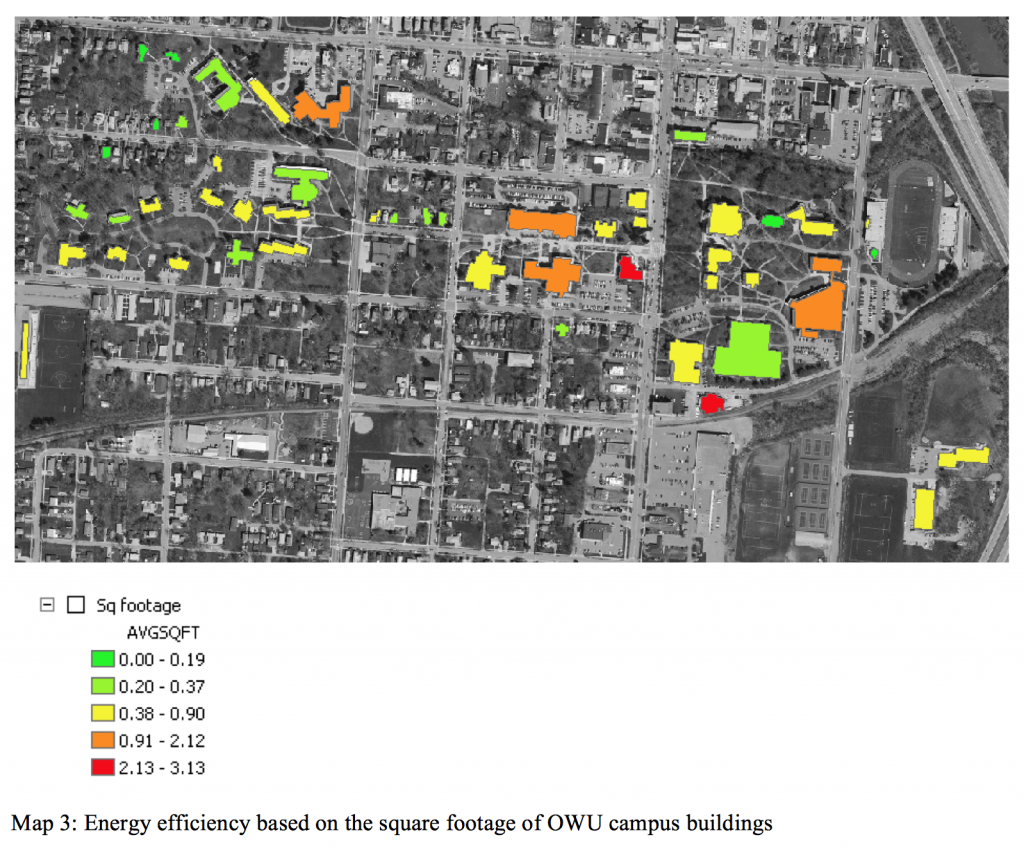
Map 3: Energy efficiency based on the square footage of OWU campus buildings:
See the full PDF report here: Building Energy Monitoring and Analysis